
Marketing today is harder than ever. Cookie tracking is broken. Journeys are fragmented. Attribution is fuzzy. You're spending thousands — and still can't clearly see what's driving conversions or where you're leaking revenue.

Digital Advertising Manager

Funnelytics is a visual funnel analytics platform that helps you track performance across your entire customer journey — without needing to be a data scientist. Whether you're a hands-on marketer or want our experts to handle it for you, we help you grow smarter.
.gif)
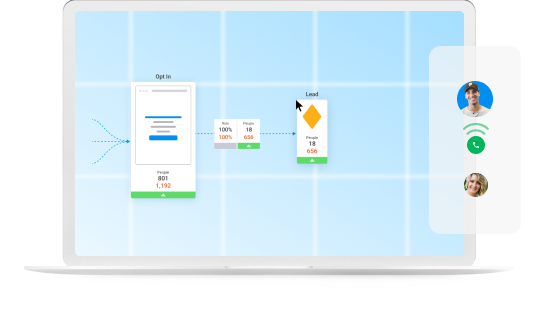
See the full journey at a glance

Capture leads, revenue, events, and more

Discover exactly what's driving results
We offer two ways to unlock growth. Pick the one that fits you best.


Use Funnelytics to map, track, and optimize performance on your own.
Start your Trial


Let our experts track and analyze your funnels — and give you the insights you need to grow.
Book a CallNot sure which is best? → Book a strategy call
Unlike basic dashboards or spreadsheets, Funnelytics gives you a real-time, visual map of how people move through your marketing funnel — and which steps are making or breaking your conversions.


See exactly how customers move through your site — from landing pages to checkout — and identify the paths that drive the most money.

Set targets, monitor results and get alerts when key results are reached (or not).


Uncover funnel bottlenecks, high-value journeys, and know exactly what to fix to boost results.


Combine ad source and on-site behavior into one clear, unified view of what’s really driving conversions.


Ads, pages, carts, upsells, LTV, and returning buyers — we plug into your existing stack and map your entire funnel.

“This tool and the Funnelytics team has been a game-changer for our organization. Their product directly solves a problem we've had for so long. We now have better visualization of what's actually happening inside our funnels (and in a much easier way).”
VP of Community Marketing
.png)
Plans built for performance — whether you go DIY or DFY.
.svg)
14-day free trial
Unlimited pageviews & events tracked
Auto-track across multiple domains
Visualize conversion & purchase paths
Advanced segmentation & reporting
Integrate with Shopify, HubSpot & GoHighLevel
Connect Meta & Google Ads
1-on-1 onboarding
Dedicated success manager
Dedicated conversion optimization expert
Detailed mapping of your customer journeys
Custom tracking setup across all key platforms
Weekly performance reports
Bi-weekly optimization calls
.png)
CMO, AppSumo
Funnelytics is one of my favourite softwares.
.png)
Funnelytics is amazing! I’m addicted to it. I love it!

Shoutout to Funnelytics! Really cool tool.
.png)
I don’t dislike anything about this software. It has helped us a great deal in making smart decisions.

Funnelytics helps us visualize our campaigns and traffic to understand flows. There’s nothing like it
Closed three deals yesterday for at least $25k – people love their Funnelytics maps!
.png)
We’ve leveraged Funnelytics to align our teams, communicate results, and simplify decision making.

I can easily visualize to clients what we’re setting up and often how well they’re working as well.

I’m fine with anyone who doesn’t see the value. It just means a greater competitive advantage for the rest of us

Funnelytics is by far my favourite tool! It’s easily made my agency hundreds of thousands of dollars over the years

I was showing the analytics to a client yesterday and he was totally blown away!

A pretty damn great software for CROs and savvy marketers who care about optimizing results.

Everything you need to know about Funnelytics
While Google Analytics shows you what happened, Funnelytics shows you why it happened. We provide visual journey mapping, cross-platform attribution, and actionable insights that help you optimize each step of your funnel.
Most customers start seeing insights within 24-48 hours of setup. Meaningful optimizations typically happen within the first 2-4 weeks, with significant revenue improvements often seen within 30-60 days.
Not at all! Our platform is designed for marketers, not developers. The visual interface makes it easy to understand your customer journeys, and our team can handle the technical setup if you choose our Done For You service.
We integrate with all major platforms including Shopify, HubSpot, GoHighLevel, Meta Ads, Google Ads, and hundreds of others via Zapier and webhooks. If you use it for marketing, we can probably track it.
Yes! We offer a 14-day free trial with full access to the platform. No credit card required to start. You can explore all features and see the value before making any commitment.
All plans include comprehensive documentation, video tutorials, and email support. Done For You customers get dedicated success managers and bi-weekly optimization calls to ensure maximum results.
Funnelytics helps you uncover the truth about your marketing — and turn insight into performance.