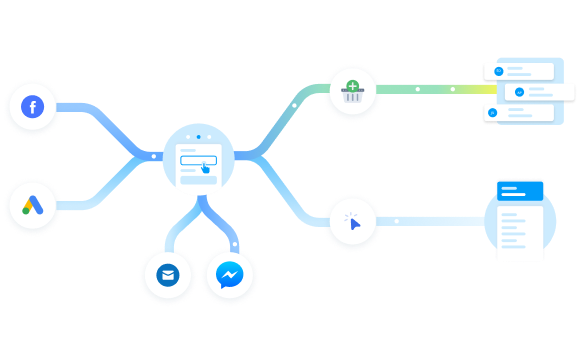
Funnelytics for Businesses
Map and analyze customer journeys
Ditch the complexities of Google Analytics and use our analytics-powered whiteboard to get actionable answers, faster.

High-performing organizations already use Funnelytics


Eliminating bottlenecks in customer journey analysis
Ditch the complexities of Google Analytics
Analyze and report on your marketing, visually.
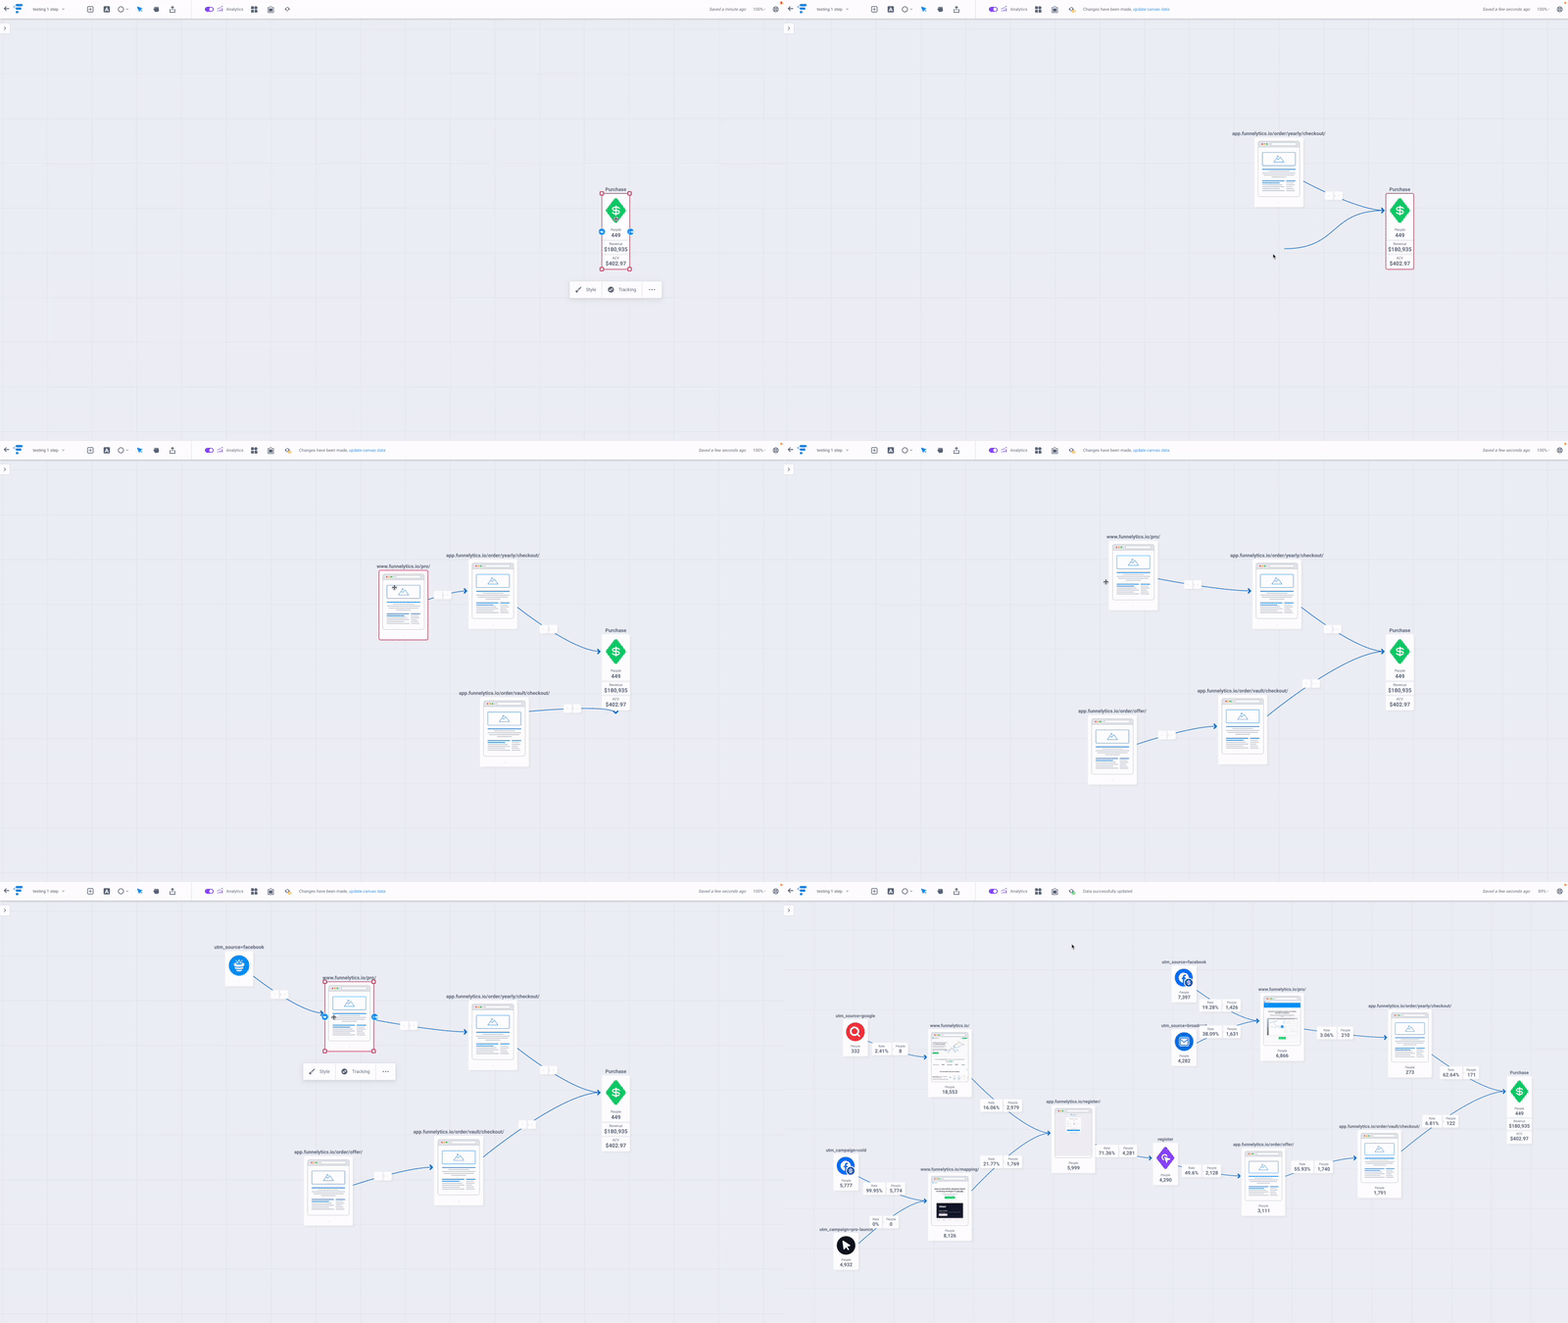
Map your customer journeys
Use our simple and intuitive customer journey mapping tool to present your strategies, sell clients and align your team.

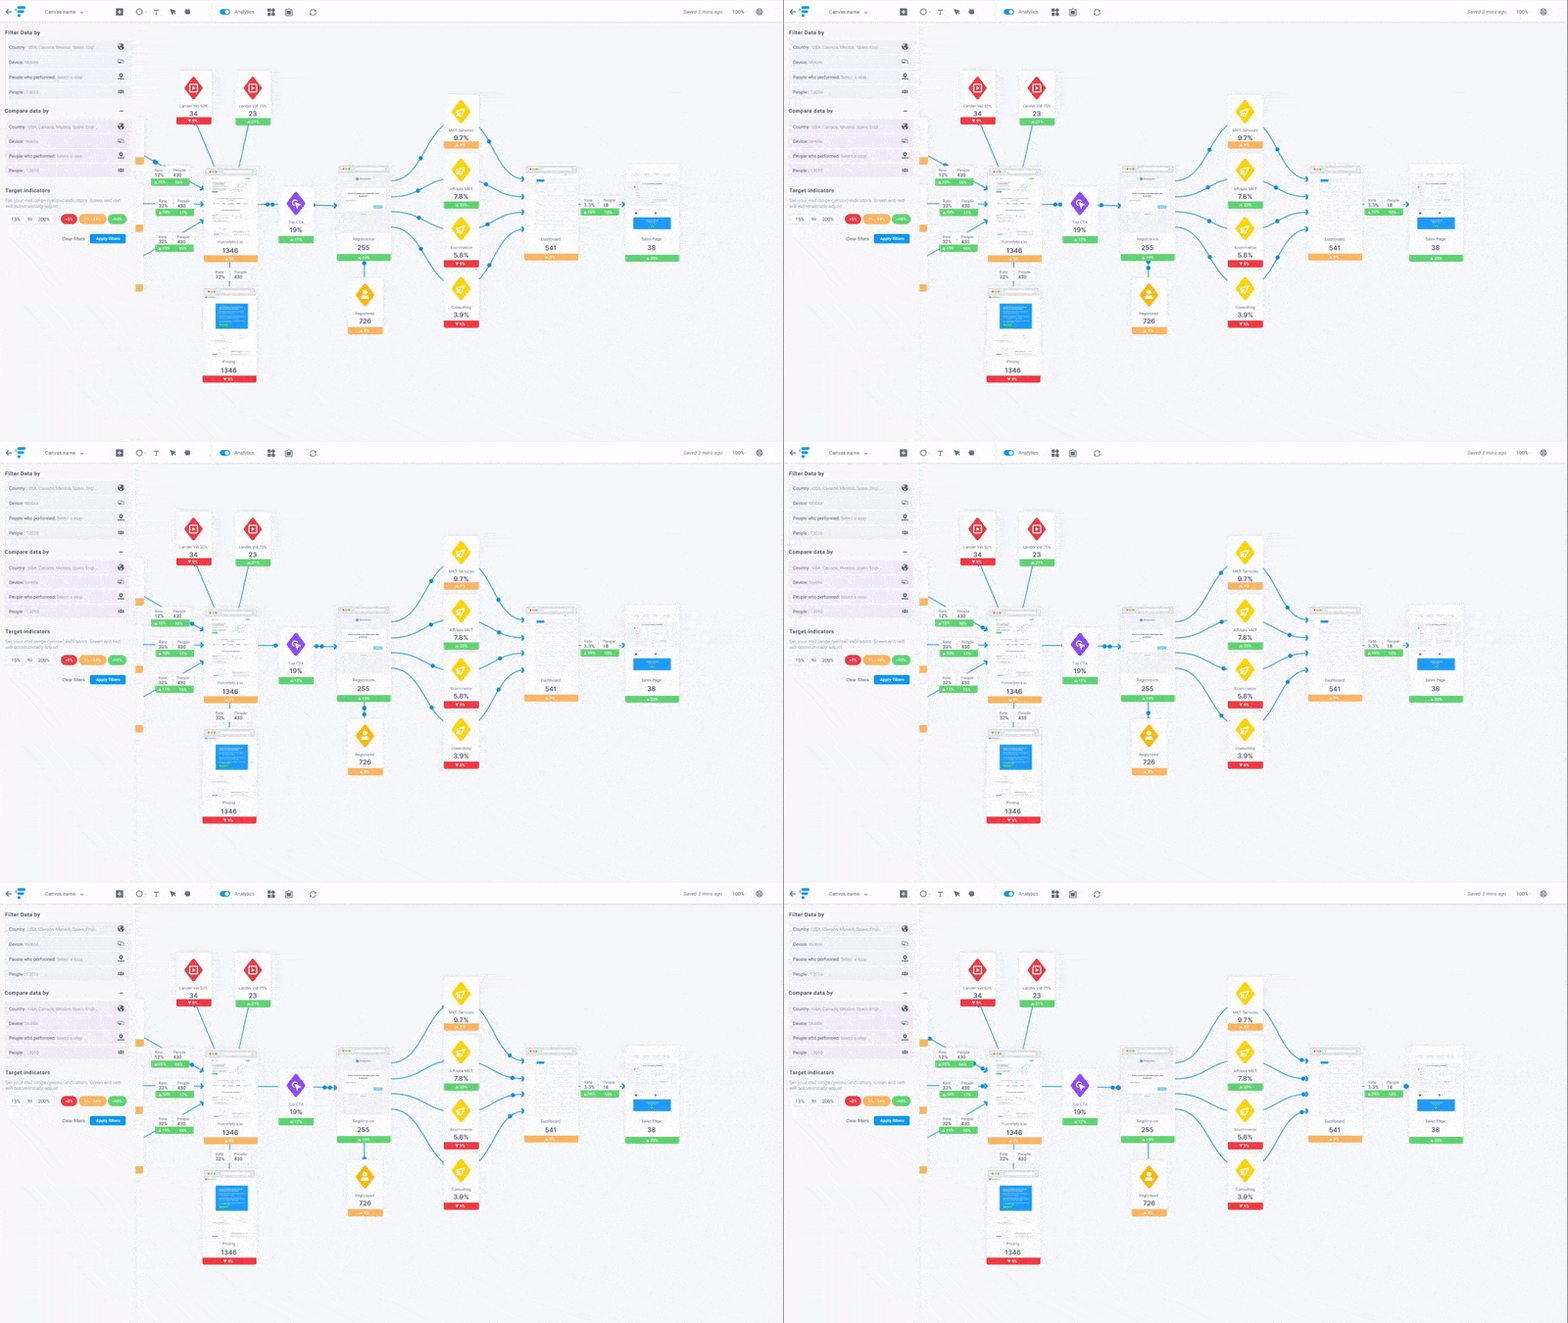
Overlay data to measure results
Use our powerful analytics tool to measure performance, monitor results and identify optimization opportunities.
Here's how Funnelytics works.
A single platform to visualize customer journeys, measure performance, and identify optimization opportunites
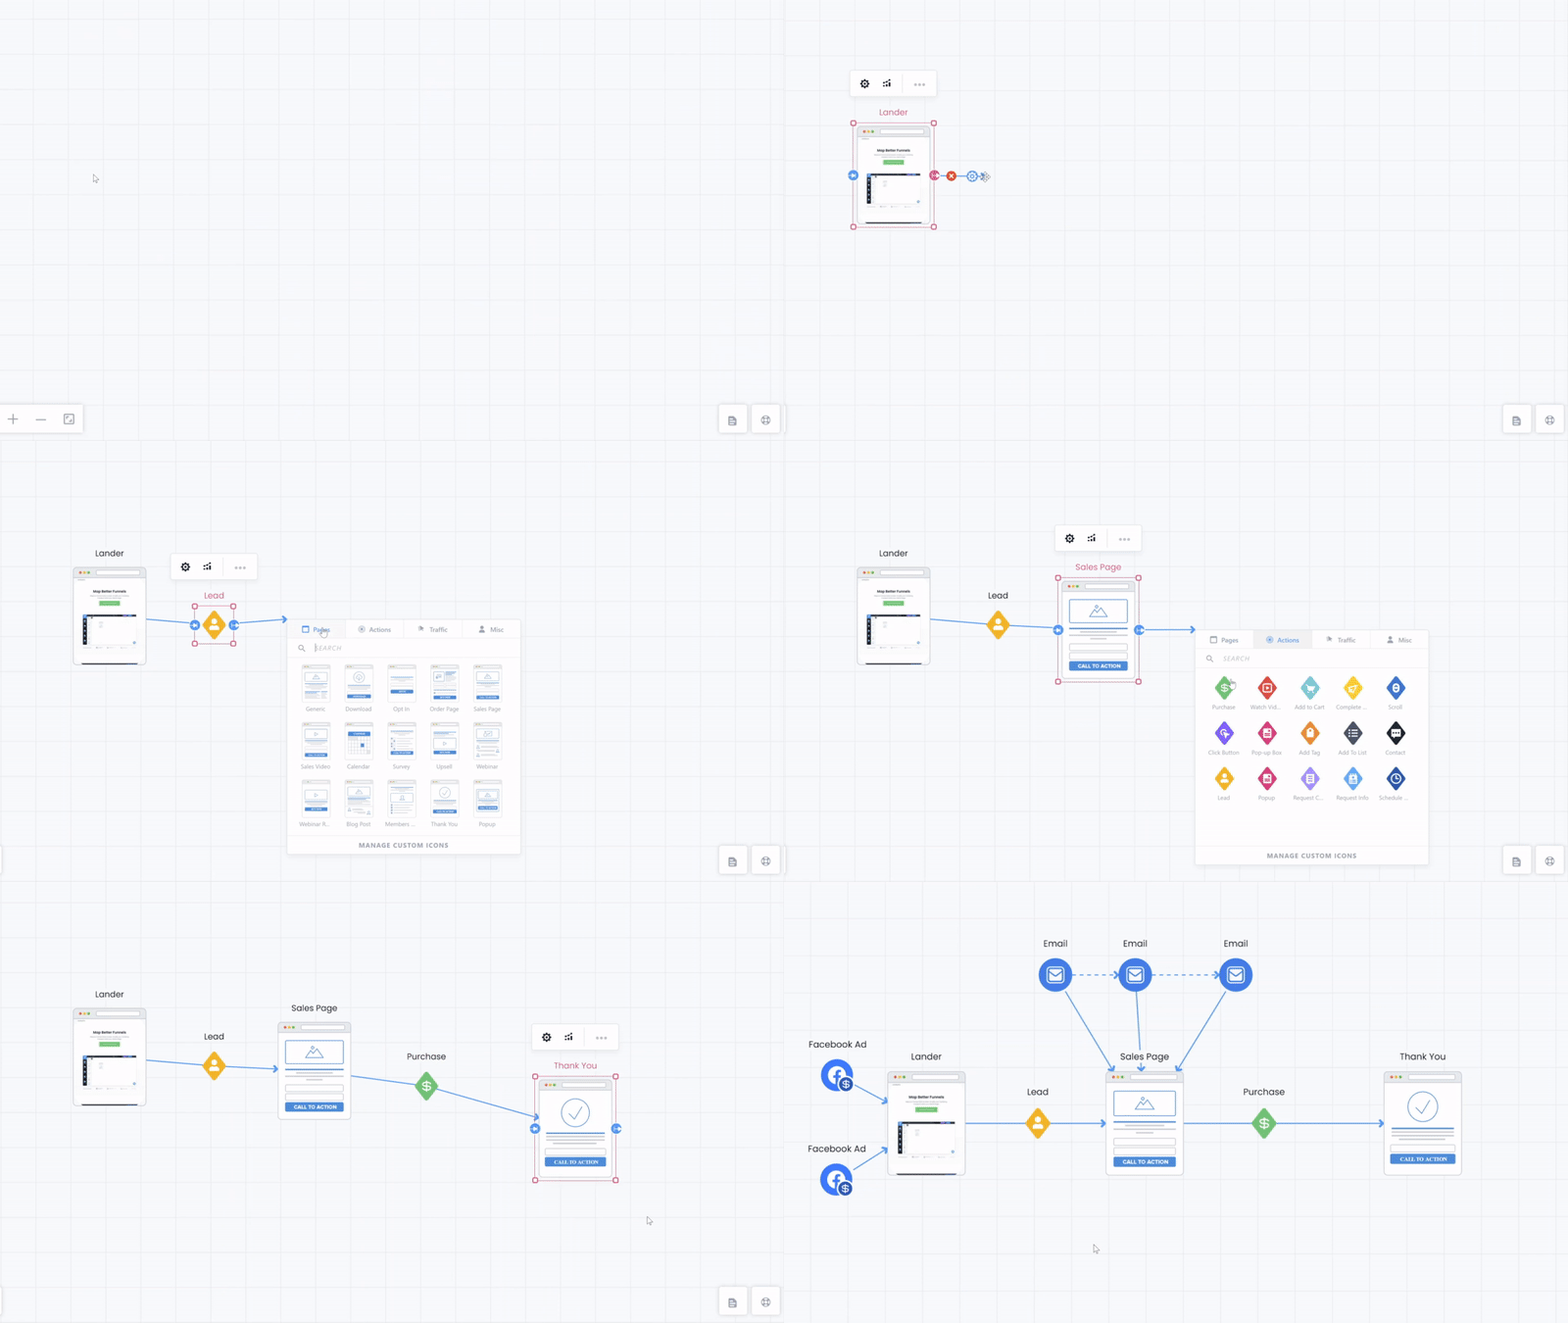
Communicate results in a way everyone understands
They say a picture is worth 1,000 words. And the same is true with your customer journey analytics data.
- See everything in context by overlaying results on top of your growth strategy
- Visually see how people get to your site, move across pages, and where they drop
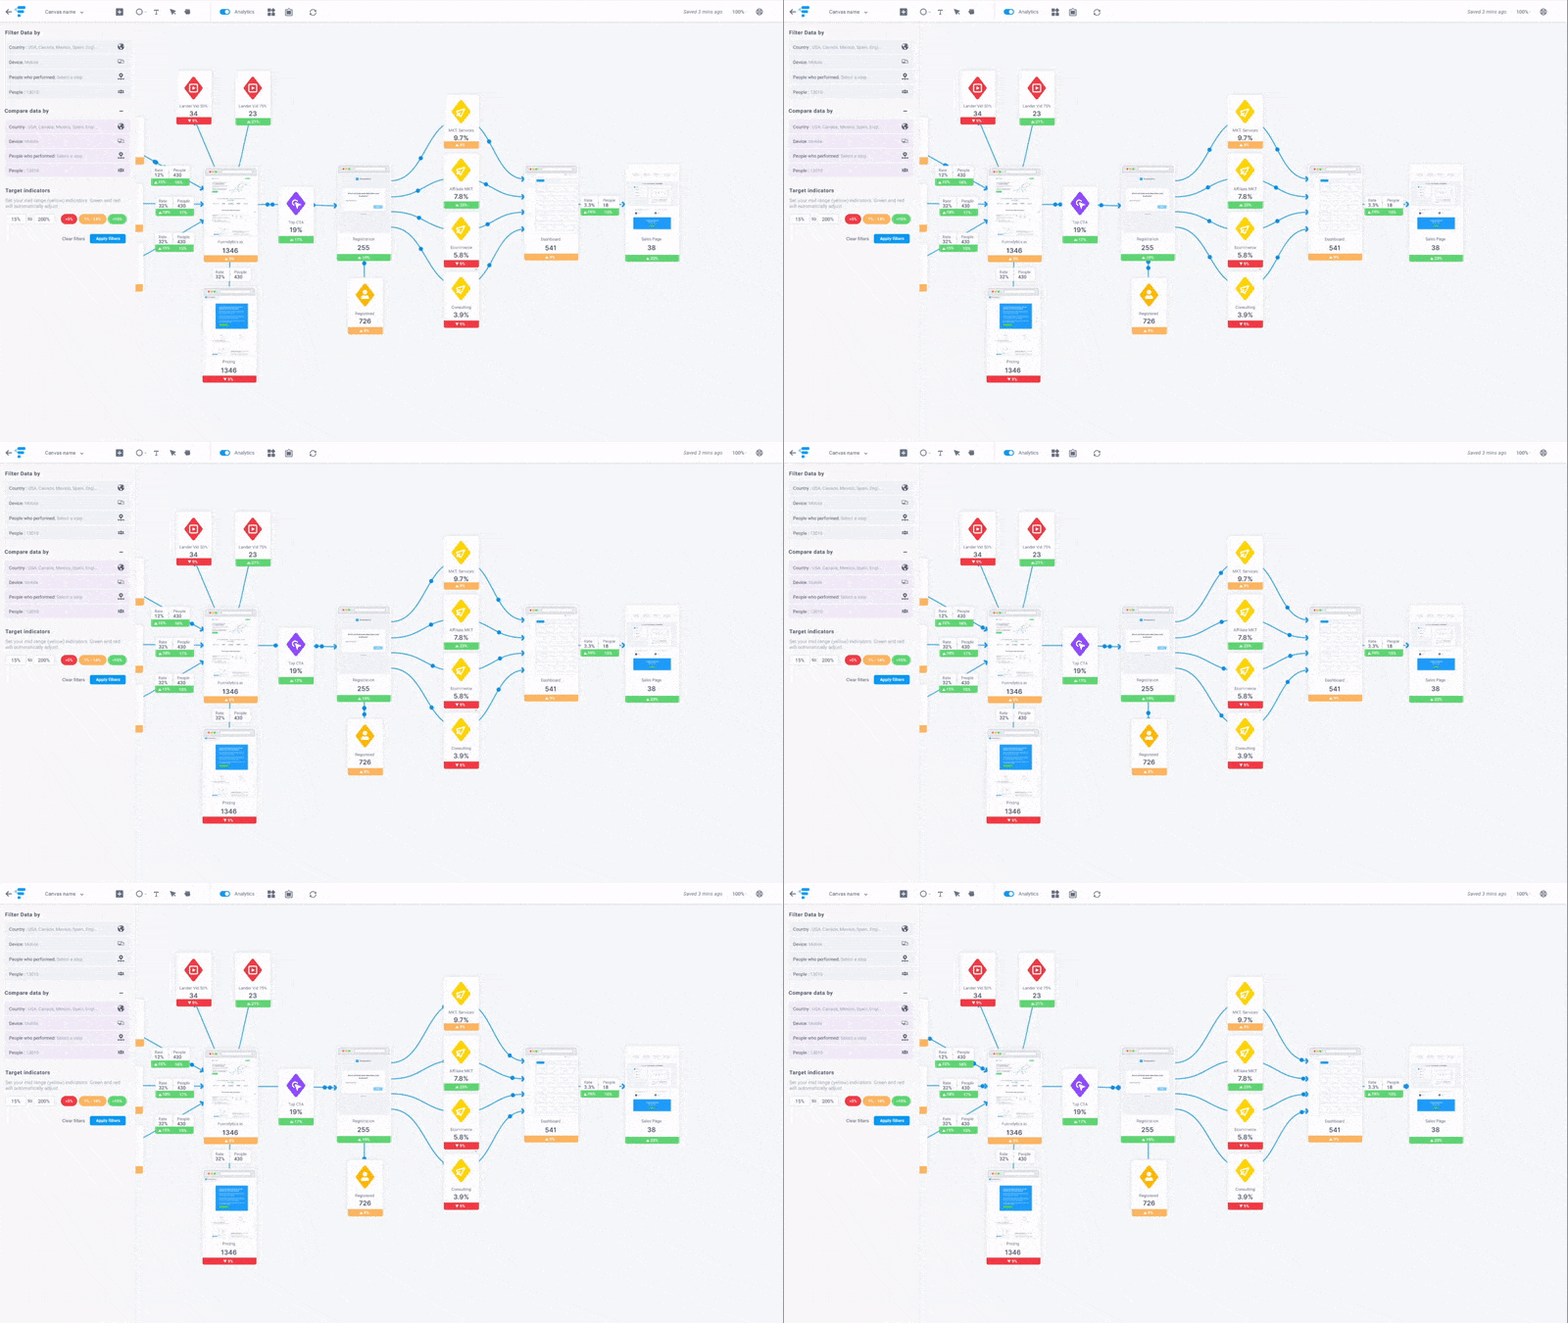
Identify bottlenecks at a glance
Monitor performance of your customer journeys, without needing a data analytics degree.
- Real time results and monitoring using a red, yellow, green light system
- Report on goals and conversions
- Instantly align your team on what’s working versus what’s not
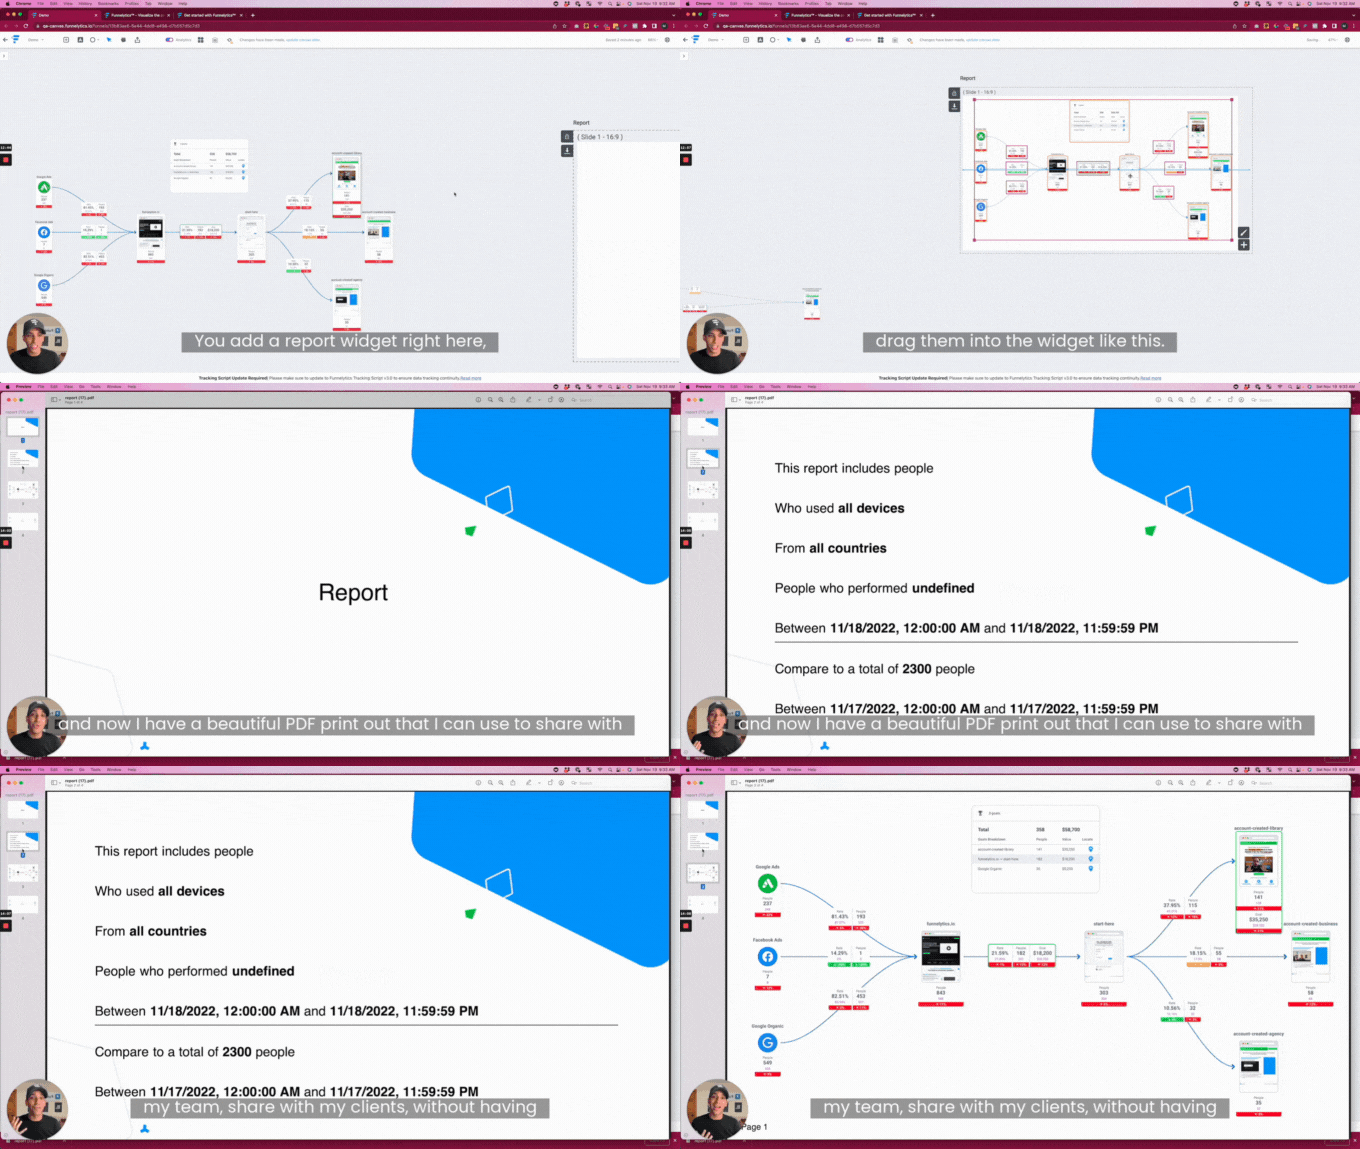
Report on insights with ease
Simply drag-n-drop your data into a report and answer any questions about what makes people convert on your site.
- Quickly report how any traffic source contributes to conversions
- Highlight how different pages and sources impact results
- No need to build spreadsheets, charts or graphs
Add rocket fuel to your customer acquisition engine
Map using data
Use our Traffic Explorer to let you map backwards from data, allowing you to see the common paths to conversion.
Filter with ease
Filter your audience based on date, country, device, or the steps they took in their journey.
Identify trends quickly
Our compare feature uses traffic light indicators to help you identify trends and bottlenecks at a glance.
Track cross domain traffic
Track your website visitors, no matter which domain they’re visiting. Set up cross domain traffic as easy as 1,2,3.
Get audience indicators
Use Data Widgets to quickly identify the top countries and people visiting your site, while keeping tabs on your goals.
Optimize for goals
Set goals and measure the results without the complicated configuration.
Integrate your data
Use our Zapier integration to connect Funnelytics to the rest of your tech stack with ease.
Create custom lists
Our CSV export feature enables you to download a list of people who took a certain step in your customer journey.
We're with you every step along the way
Ongoing support from optimization specialists.
We're with you every step along the way. Ongoing support from optimization specialists


We’re here to help you grow. Our world class performance implementation program provides you with ongoing access to and support from our very own Funnelytics Optimization Specialists.
Product Tour
Take a tour of Funnelytics
Grow and align your business with the
right plan

Funnelytics™ Performance
For performance-driven marketers who wants to visualize customer journeys and get powerful insights.
$199/month
Your journey planning and reporting tool…
- Map traffic sources, pages and actions on an infinity whiteboard
- Track up to 25,000 people per month
- Visualize the customer journeys and conversion paths
- Automatically track sources and pages across multiple domains
- Get key conversion insights and report results

Funnelytics™ Performance Plus
For performance-driven teams that want advanced insights and reporting for multiple clients.
Everything in Performance, plus…
- Advanced insights and powerful segmentation
- Track purchases, form submissions and calendar bookings
- Auto-track video views, button clicks, link clicks and more
- Integrations to 1,000+ apps via Zapier and Webhooks
- Add multiple client workspaces (3 included, with each additional client workspace @ $100/mo)
- Track more volume (100,000 people per month included, with each additional 100k people @ $30/mo)
- Optional - Join our Agency Partner program and we'll help you grow your profits
Not ready to get started at the performance level?
Access Funnelytics™ Map to visualize and present customer journeys, without data.
$39/monthly
We're commited to
your success.
Our team has implemented Funnelytics hundreds of times. We’re here to help you get off to a strong start. Here’s how we do it.
Step 01
Complementary Onboarding
We work with you to define your goals and tell you how to set up your account to meet your specific needs, right at the start of your free trial experience.
Step 02
Optimization workshops
We have a roster of customer journey experts here to help you get better results. We'll teach you how to analyze and extract insights from your data.
Step 03
Same-day support
We host weekly live sessions. Ask us anything—platform or strategy related! Or just shoot us an email — we're here for you.
We're with you every step along the way
Ongoing support from optimization specialists.
We're with you every step along the way. Ongoing support from optimization specialists


We’re here to help you grow. Our world class performance implementation program provides you with ongoing access to and support from our very own Funnelytics Optimization Specialists.
Wall of love.
Look at why our customers love Funnelytics.
Funnelytics is one of my favourite software.

Russell Brunson
Co-Founder & CEO, Clickfunnels
Funnelytics is amazing! I’m addicted to it. I love it!

Anik Singal
Founder & CEO, Lurn Inc
Shoutout to Funnelytics! Really cool tool.

Billy Gene Shaw
Founder, Billy Gene is Marketing
I don’t dislike anything about this software. It has helped us a great deal in making smart decisions.

Neha P.
Marketing Manager
Funnelytics helps us visualize our campaigns and traffic to understand flows. There’s nothing like it

Chris Schelzi
CMO, AppSumo
Closed three deals yesterday for at least $25k – people love their Funnelytics maps!

John Ainsworth
CEO, Data Driven Marketing
We’ve leveraged Funnelytics to align our teams, communicate results, and simplify decision making.

Chris Breikss
Founding Partner, Major Tom
I can easily visualize to clients what we’re setting up and often how well they’re working as well.

Andrew M.
Founder/CEO
I’m fine with anyone who doesn’t see the value. It just means a greater competitive advantage for the rest of us

Brent Kaluhikaua
Owner, Ohana Media
Funnelytics is by far my favourite tool! It’s easily made my agency hundreds of thousands of dollars over the years

Baillie Thornhill
Managing Director, Conscious Lead
I was showing the analytics to a client yesterday and he was totally blown away!

Mitch A.
CEO, Giveaway Rocket
A pretty damn great software for CROs and savvy marketers who care about optimizing results.

Teddy Marie
Growth Hacker, CESAD
FAQ
Frequently Asked Questions
At the core, Funnelytics Performance is the same across all plans. With all 3 plans you can overlay analytics on top of your customer journey map. The core difference is how much of the journey you can visualize, how many people you can track, and the support level we offer.
Performance Lite is a simple one-code install that allows you to see the traffic sources that people come from and the pages that they visit. You can track up to 25,000 people profiles per month and we offer on-demand training and support.
Performance Plus allows you to track more complex on-site actions like videos, button clicks, scroll, form submissions and purchases using Google Tag Manager. You can track up to 100,000 people profiles per month (with additional tracking packages available), and we offer premium support.
Performance Lite is simple and quick to set up. It involves a one-code install and you’ll be collecting data in a matter of minutes.
Performance Plus requires javascript and Google Tag Manager knowledge. We have many pre-built containers for you to leverage or you can hire our team to get you set up in a few days.
Performance Max requires a technical audit and setup times vary depending on tech stack. Contact us and we’ll give you a proper estimate.
The data is pulled directly from your sites and pages through our tracking script, providing you with insights you can trust. We value privacy and security — and we’re fully GDPR-compliant to prove it.
GA4 is adopting similar people-centric tracking technology that we’ve been doing for years. We collect similar data, but our platform lets you visualize performance, while GA4 user journey reports and insights still requires you to analyze charts and dashboards. With Funnelytics, you can manipulate data and understand performance by simply dragging and dropping icons on a canvas in a way that everyone understands.
Channel attribution gives you insights into how to distribute your ad spend across platforms, but doesn’t tell you what happens in between. Funnelytics provides this crucial data so you can generate more revenue from your existing traffic, without spending more on ads.
When you go over your plan’s limit, we’ll automatically upgrade it to the next level. Your account won’t skip a beat. You’ll continue gathering data and tracking the people that come to your site.
Absolutely! We’ll guide your team on exactly what to implement, continually analyze your funnel performance, and provide a list of prioritized action items and opportunities.
Your team will have full access to our Funnelytics Hub where we house all our training videos.
