Marketing Analytics Guide + Examples & Useful Tools (2024)

by Mikael Dia

January 9, 2025

With a sea of marketing data available at your fingertips, the real struggle is not data collection but making sense of it all. The solution? Marketing analytics – which has helped 76% of businesses improve both their performance and customer satisfaction. So, if you want to stay competitive, it’s something you can’t afford to overlook.
To help you with this, we’ve created this guide that walks you through the essentials of marketing and data analytics, from different types to actionable strategies and tools.
Marketing analytics is the practice of measuring, managing, and analyzing marketing performance to optimize its effectiveness and maximize ROI. It involves collecting and analyzing data from various marketing activities and channels and using that data to gain insights into consumer behavior, campaign performance, and overall market trends.
Marketing analytics lets you use data to make smarter business choices. It helps you fine-tune your strategies, spot areas that need improvement, and get better results overall. Knowing how your marketing is performing is crucial. Marketing analytics makes sure you’re using your resources as efficiently as possible.
As you go through this section, think about how you can use each type to enhance your strategy—whether you’re looking to understand past performance, see current capabilities, predict future outcomes, or get actionable recommendations.

Descriptive data analytics focuses on understanding past performance by analyzing historical data. It answers questions like “What happened?” and “What was the outcome?”
Examples: Reports on sales trends, website traffic analysis, customer data, and customer demographics.
Use Case: A company can use descriptive analytics tools to determine which marketing campaigns were most successful last quarter by analyzing metrics like click-through rates and conversion rates.
Predictive analytics is data analytics that uses statistical models and machine learning techniques to forecast future outcomes. It answers questions like “What could happen?” and “What is likely to happen?”
Examples: Predicting customer behavior, forecasting sales, marketing research, and identifying potential market trends.
Use Case: A brand could use predictive analytics to anticipate which products customers are likely to buy during a particular season. This helps with better inventory management and targeted, marketing initiatives.
Prescriptive analytics suggests actions you should take based on data analysis. It answers questions like “What should we do?” and “How can we achieve the best outcome?” to optimize decision-making.
Examples: Recommending strategies, optimizing pricing models, using marketing metrics, and determining the right channel for advertising.
Use Case: A company might use prescriptive analytics to determine the optimal mix of marketing channels to maximize ROI for a new product launch.
The real value of marketing analytics is in its application. As you go through these 8 key areas where marketing analytics can transform your business, think of ways to turn these data insights back into strategies to get the best out of them.

Your website is the digital front door to your brand, but do you know how well it’s performing? Website analytics opens the door to understanding your visitors’ behaviors, from when they land on your page to when they (hopefully) convert. Here’s how it can help:
Let’s consider Golf Cart Tire Supply, a brand that sells golf cart tires and accessories. For a niche business like theirs, where customers are looking for specific products, knowing how well the website performs can make all the difference.
Unlike broader markets, their customer base is more specialized and comparatively smaller. So they need website analytics to be meticulous about how they understand the behaviors and preferences of this niche market and how they attract and engage them.
Website analytics will let Golf Cart Tire Supply track where their visitors are coming from and which channels are most effective in driving traffic. This is especially important for them because they need to ensure that their marketing efforts are reaching the right audience – golf enthusiasts and cart owners.
Plus, analyzing user behavior on their site will help them understand how potential customers interact with their content and products. If a visitor is struggling to find the right tire or accessory, it can cause frustration and lost sales. Website analytics lets them streamline the purchasing process and improve overall customer experience and site performance.

Social media is a goldmine of insights waiting to be uncovered. Social media analytics dives deep into the numbers behind the likes, shares, and comments to reveal what truly resonates with your audience. Let’s see how it helps:
In the beauty industry, which relies heavily on visual content and consumer engagement, social media is a crucial medium. With 72% of Instagram users making beauty or style decisions based on what they see on the platform, it is an absolute necessity for brands like Shay & Blue to understand what clicks with their audience.
Social media analytics can help Shay & Blue dive deep into the metrics that matter most. They can track engagement levels on Instagram and Facebook to identify which social media posts – whether it’s about a new fragrance or an influencer collab – are most effective in driving interaction and sales.
Shay & Blue can use audience insights to create personalized content that highlights their unique fragrances and makes them more appealing directly to their followers’ preferences. Competitor analysis will reveal which scent trends are popular so that Shay & Blue can innovate and stand out.
They can use Hootsuite and Sprout Social to track engagement on their scent launch posts and refine their strategy to increase likes, shares, and comments for increased sales and brand loyalty.

With 80% of customers preferring email communication from sales reps, email marketing remains one of the most effective tools. However, it only works if you’re tracking the right metrics. Email marketing analytics software takes the guesswork out of your marketing campaigns by revealing exactly what works and what doesn’t. Here’s how it helps:
In the visually-driven and seasonal world of beachwear, online retailers like Simply Beach need to ensure that their email marketing campaigns are precisely targeted and engaging. For a business in its niche, where trends and timing are crucial, getting email marketing right is essential.
Tracking open rates will help them fine-tune their subject lines and, most importantly, their email headers, while also figuring out the best times to land in their customers’ inboxes. This is particularly critical in the beachwear industry, where the right timing can make all the difference between a customer browsing their site or moving on to the next brand.
Click-through rates provide another layer of insight. Simply Beach can use this data to see which of their promotions or product categories – like the latest swimwear collections or must-have beach accessories – capture the most interest.
Plus, tracking conversion rates will help Simply Beach understand which email campaigns translate into actual sales. They can then focus on crafting emails that generate purchases, rather than just clicks, which boosts their ROI.

Sales funnel analytics maps out the consumer journey and identifies exactly where prospects drop off and where you can reel them back in. Here’s what to look for:
In the fitness apparel industry, where customer loyalty and repeat purchases are key, niche brands like Tailored Athlete must identify drop-off points in the sales funnel. Why? Because this business, like any niche brand, faces the challenge of turning interest into action.
For instance, if they notice a high abandonment rate at the cart stage, they can dig into why this is happening. It could be due to unexpected shipping costs, complicated checkout processes, or even just a lack of trust signals.
Tailored Athlete can then implement retargeting campaigns to remind customers of their abandoned carts or send personalized email follow-ups to address concerns and encourage completion of the purchase. They can also enhance their product pages with detailed information, customer reviews, or clear CTAs to make the buying process smoother and more inviting.
Plus, they can break down the lead generation and conversion rates at each stage of the funnel and adjust their campaigns accordingly. This helps them ensure that each touchpoint – from discovery to purchase – feels seamless and tailored to the customer’s needs.
To achieve this level of optimization, Funnelytics provides the tools needed to visualize and optimize your sales funnel. Our platform will help you track customer journeys and improve conversion rates across all touchpoints. This ensures that every interaction is geared towards both conversion rate and customer satisfaction.

Ranking high on search engines is a science. SEO analytics provides the data-driven insights you need to reach the top of search results. Here’s how it can help:
In the highly competitive financial services industry, visibility on search engines is crucial for companies like EE Mortgages. SEO analytics provides the data-driven insights they need to improve search engine rankings and drive more organic traffic to their site.
For EE Mortgages, ranking high for relevant keywords like “mortgage broker” or “home loan services” helps them attract potential clients. SEO analytics allows them to track keyword performance, refine their content strategy, and analyze their backlink profile to build authority in the financial niche.
These insights help them improve their chances of brand recognition and appearing at the top of search results, which is critical in a market where clients are searching for trusted, credible services.
Using tools like SEMrush and Ahrefs, EE Mortgages can gain a comprehensive view of their SEO performance and make informed decisions that boost their online visibility and credibility.

A/B testing lets you test your marketing ideas before fully committing. You can experiment with different versions of your strategies to choose the one with the best performance. And it’s not just about content – you can test headlines, CTAs, landing pages, ad copies, pricing, and more to find out what truly resonates with your audience and drives conversions.
Here’s how you can use it:
In motorcycle aftermarket accessories and parts, competition is fierce and the stakes are high. For an online trader like Moto Machines, standing out isn’t just a matter of offering the right products—it’s about fine-tuning every aspect of their marketing strategy.
Moto Machines, which caters to motorcycle enthusiasts who are often very particular about their gear, can use A/B testing to ensure that every element of their marketing is hitting the mark. For instance, they can experiment with different headlines and images on their product pages to see which ones grab the most attention.
Since their audience might be drawn to highly specific features or styles, testing these variations can reveal what really drives clicks and, more importantly, conversions.
In the online automotive industry, where customers often compare products before making a purchase, even the timing of an email or social media post can make a difference. Moto Machines can experiment with different times of day or days of the week to discover when their audience is most likely to engage.
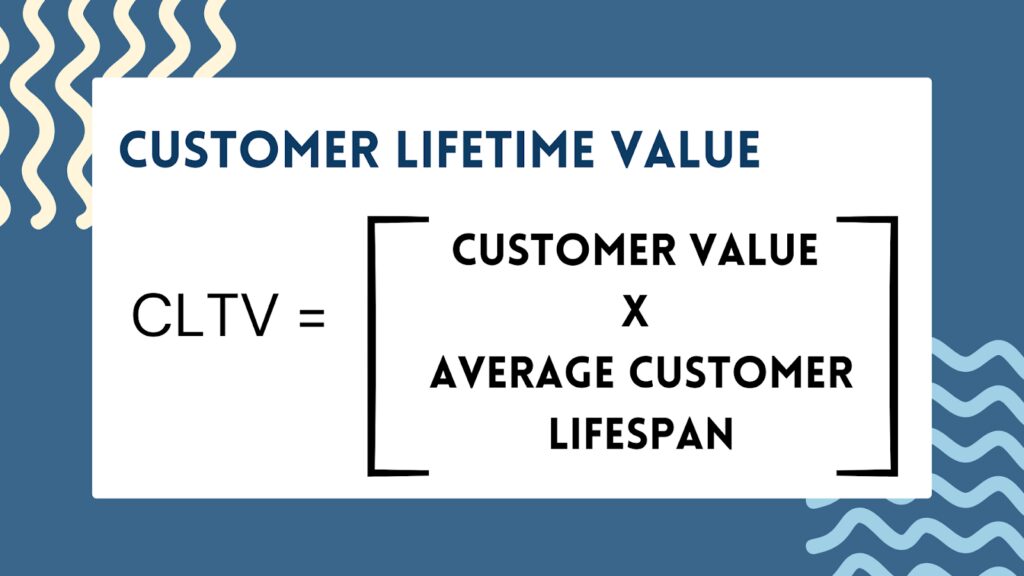
CLTV analysis helps you identify high-value customers and develop strategies to keep them returning. Here’s how you can use it:
In the competitive world of fashion and accessories, customers have endless choices. So online brands like Andar must build long-term relationships with high-value customers for sustained success. And CLTV analysis is the best way to go about it.
For example, frequent buyers of premium leather products might form a segment that Andar can target with exclusive offers or early access to new collections. They can also develop targeted retention strategies that resonate with their most valuable customers. Imagine receiving a custom offer for a matching accessory to the wallet you purchased last year – it’s this kind of personalized touch that keeps customers coming back.
Plus, in this industry, trends change rapidly, and it’s easy for customers to move on to the next big thing. CLTV analysis can help Andar predict which customers might be at risk of churning and lets them take proactive steps to retain them. Whether it’s a special discount or a timely follow-up, these actions can make a big difference in keeping customers engaged.
Similarly, if a customer frequently purchases leather phone cases, Andar could suggest a matching leather bag or wallet. These thoughtful recommendations enhance the customer experience and also boost overall revenue.

Pay-per-click advertising can be a fast track to driving traffic – if done right. PPC analytics lets you analyze the data to ensure your paid campaigns deliver the best possible return on investment. Here’s how it helps marketers:
In an industry where the purchase cycle can be longer and more considered, companies like Pergola Kits USA need to reach potential customers who are actively searching for outdoor structures. This makes PPC one of the most effective ways to drive targeted traffic.
PPC analytics allows them to track the performance of keywords like “custom pergola kits” or “DIY outdoor structures,” helping them focus their bidding strategy on the terms that are most likely to lead to sales.
Also, customers need more convincing because of the higher investment involved in their products. PPC analytics lets them test different versions of their ads. For instance, highlighting features like “easy assembly” or “customizable designs” generates higher click-through rates and conversions, as these are key selling points for their audience.
Geographic performance analysis is particularly important for PergolaKitsUSA, as outdoor structure needs can vary greatly depending on the region. For instance, ads might perform better in warmer climates where outdoor living is more common, allowing them to focus their efforts where they’re most likely to see a return.
As you review our expertly-created systematic approach, think about how you can apply them to your current or future strategies.
Do you want to increase your customer lifetime value, boost conversion rates, or reduce churn? Whatever your goals are, make sure you’re defining them clearly and in measurable terms. For specific goals that are aligned with your overall business objectives, do the following:
Focus on metrics that align with your business objectives and provide actionable insights. Here’s how to identify and use them effectively:
Data is the backbone of marketing analytics. Follow these steps to ensure you gather and use marketing data properly:
Once you have your data, the next step is to both interpret data and use it to optimize your digital and marketing activities and campaigns. Analyze the data to identify what’s working and adjust your strategies accordingly.
The tools you select can make or break your analytics and marketing professionals’ effectiveness. Go through these options and weigh out their pros and cons to find the one that best fits your needs and requirements.

Funnelytics is a powerful visual analytics tool specifically designed for marketers. You can easily visualize how your users move through the funnel, find any bottlenecks, and optimize your funnel for higher conversions through its intuitive drag-and-drop interface.

Google Analytics 4 is an advanced business analytics tool that gives you a more comprehensive understanding of user behavior across websites and apps. With its enhanced machine learning capabilities and cross-platform tracking, GA4 offers a more complete view of the customer journey.

HubSpot Marketing Hub integrates CRM with marketing analytics to seamlessly track customer interactions, measure campaign effectiveness, and optimize marketing strategies across multiple channels.

SEMrush is an all-in-one tool that excels in SEO, content marketing, and competitive research. It offers detailed insights into keyword rankings, backlink profiles, and organic search performance, helping you refine your SEO strategies to improve your site’s visibility and drive more traffic.
High Cost: Premium features come at a high cost, which might be prohibitive for smaller businesses.

Tableau is a powerful data visualization tool that transforms raw data into intuitive, interactive dashboards. It’s ideal for marketers and thought leaders who need to analyze large volumes of datasets and present their findings visually compellingly.
Marketing analytics is an essential part of your marketing strategy for overall marketing success. Without it, you wouldn’t make heads or tails of your marketing strategies, the bottlenecks you’re facing, and the changes needed to improve customer experiences.
Funnelytics lets you track, report, and optimize your customer journeys on a visual canvas, making your marketing efforts more streamlined. Its accurate, actionable insights help convert more leads and customers from your marketing funnel. Start mapping your success today and see the difference a visual approach can make.

Author Bio:
Burkhard Berger is the founder of Novum™. He helps innovative B2B companies implement modern SEO strategies to scale their organic traffic to 1,000,000+ visitors per month. Curious about what your true traffic potential is?

Founder & CEO @ Funnelytics Inc.
Sign up for your free 14-day trial today and experience all the benefits Funnelytics will bring to your business first-hand. No contracts. No commitments. Just full-on customer journey insights.
.png)

