FUNNELYTICS ECOM · DONE FOR YOU

Funnelytics Ecom · Shopify LTV Profit MapMake a lot more from the traffic you already pay for.

For 8-figure ecom stores, we set up your tracking and attribution, find where your store loses buyers, and tell you exactly what to change. Convert more of the same traffic, so every increase in spend compounds instead of shrinking your returns.

Scorecard
Product page click map
Recommended layout
Hero vs draining entry products
PulseWeekly

Sample Pulse · built from Feetures data

Colour is the main decision on your top PDP

Colour is the top interaction on the page: 8,295 people (32%). Arctic Forest Mix drew the most clicks (2,729), ahead of the default Wild Mist Mix (2,180).

Do this: Order swatches by popularity and drop the ALL / SEASONAL tabs.

“I've taken two companies from 0 to $15 million while using Funnelytics.”

Bren Higuera
Bren Higuera
Growth Marketer, VIIA & Indacloud

“100% recommend Funnelytics... We've improved mobile conversions by 20%.”

Jessi Means
Jessi Means
Director of Marketing, ChappyWrap

“Funnelytics helped quiet down that noise and gave us a reliable source of data we can rely on to make decisions.”

Eyal Marmareli
Eyal Marmareli
Trophysmack

Trusted by eCommerce brands scaling paid traffic.

VIIAFour SigmaticHUMANNTrophySmackChappyWrapLegacyboxLogitechButtermintsFeetures
The Problem

Your real problem is converting the traffic you already have.

Attribution and ROAS tell you which channel got the click. They do not tell you why most visitors leave without buying.

You are running ads. You are driving traffic. You are generating sales. But when you rely on attribution and ROAS alone, results drop as you scale. Each new dollar buys less, because the store converts the same share of visitors it always did.

What you still can't see:

?Where in your store buyers drop off
?Which pages and products turn visitors into customers
?Where to send traffic so more of it converts

Once your overall conversion improves, you know exactly where to spend, where to send traffic, and what to fix to convert better. That is how the same spend makes a lot more.

How it works

Three steps, done by our team.

Each step has one job: help you make more from the traffic you already pay for.

01

Collect Data: see every order next to the visit that made it.

Your Shopify orders live in one place and your site traffic lives in another. That gap is why spend gets cut in the wrong places. We install the script, capture every purchase and order, and tie each one to what that visitor did on your site, so it all sits in one customer view.

Every order and purchase captured
Each order tied to the visit and pages behind it
See who your highest-value customers are and where they come from
Shopify orders & purchases
Order
Repeat order
First purchase
Site traffic & behavior
Ad click
Product page
Add to cart
One customer view
Source
Pages viewed
Orders
Customer value
02

Analyze with AI, daily, weekly and monthly.

We map the full journey your buyers take, from the ad to the product page to checkout, and find the step where paid traffic stops converting. AI reviews it every day, week and month, and our team checks what it finds, so you know where the next dollar of spend will actually turn into revenue.

Full journeys from ad to purchase
The exact step where buyers drop off
Clicks on collection pages, product pages and menus
JOURNEY MAPExample
Meta Ad
62%
Product page
Leak detected: product page to cart

Example: many visitors reach the product page from the ad, but too few add to cart. That is where spend is leaking.

Example diagnosis
-22%
Checkout
48%
Purchase
Product page clicks
Collection page clicks
Menu clicks
03

Take action based on what customers actually do.

You get a recommended layout for your key pages, with analyst notes that show what to fix and why. Every change comes from what your customers actually did. Convert more of the traffic you already have, and every increase in spend works harder instead of shrinking returns. Every recommendation is 100% based on your store's data, not opinions.

Current layout next to the recommended one
Analyst notes behind every change
Clear next steps for your team
Current product page
Recommended product page
Analyst notes
Example
  1. 1
    Most Meta visitors never reach the reviews

    62% of mobile visitors from Meta exit the product page before scrolling to reviews.

    So reviews move above the fold, right under the buy box.

    Example data · Journey map
  2. 2
    Add to cart is where spend leaks

    Product page to cart drops 22% below the store average for Meta traffic.

    So the add to cart button stays visible on scroll for mobile Meta visitors.

    Example data · Journey map
  3. 3
    Size questions stall the decision

    41% of product page visitors who open the size guide leave without adding to cart.

    So a short fit summary goes next to the size selector.

    Example data · Product page report
  4. 4
    Checkout holds once people get there

    48% of shoppers who reach checkout complete the purchase.

    So budget goes to fixing the product page, not to checkout changes.

    Example data · Journey map

Feetures example. Results vary by store.

CUSTOMER RESULTS

Real results from eCommerce brands turning traffic into more customers

$0 → $15M
Two brands scaled from zero using Funnelytics
Bren Higuera · Growth Marketer, VIIA & Indacloud

Bren Higuera · Growth Marketer, VIIA & Indacloud

+20%
Mobile conversion rate after overhauling the PDP
Jessi Means · Director of Marketing, ChappyWrap

Jessi Means · Director of Marketing, ChappyWrap

+46%
Average order value from journey-led changes
Rick Cadotte · VP of Growth, Four Sigmatic

Rick Cadotte · VP of Growth, Four Sigmatic

Featured Shopify wins

ChappyWrap lifted mobile conversion 20% by finding exactly where mobile buyers fell off

Pinpointed the mobile PDP as the drop-off point
Overhauled and A/B tested it top to bottom
+20% CVR increase

Indacloud scaled to $15M by sending traffic where the data said to

Spotted bestsellers page converting far above “shop all”
Redirected ad traffic and saw an immediate revenue lift
$15M revenue

Trophysmack ended the war between Shopify, GA4, Meta, and Amazon data

Replaced conflicting dashboards with one reliable view
Sees the full flow — source → landing page → checkout
1 source of truth

VIIA lifted AOV 27% by finding which products and paths drove their best customers

Identified highest-LTV products and journeys at $500K+/mo
Rebalanced traffic towards paths that produced high-LTV
+27% AOV increase

Watch them describe the moment
their numbers finally made sense

Real growth teams, real stores, real lifts. No scripts.

"When you don't know what data is even true, it's very hard to prescribe the solution."

"We can see the truth and what's actually converting — so we're spending less and getting much higher conversions."

"Without Funnelytics, we were kind of flying blind."

"I've taken two companies from 0 to 15 million while using Funnelytics."

Case study library

Want to go deeper? Every number links to the full story.

Purchase conversions case study preview
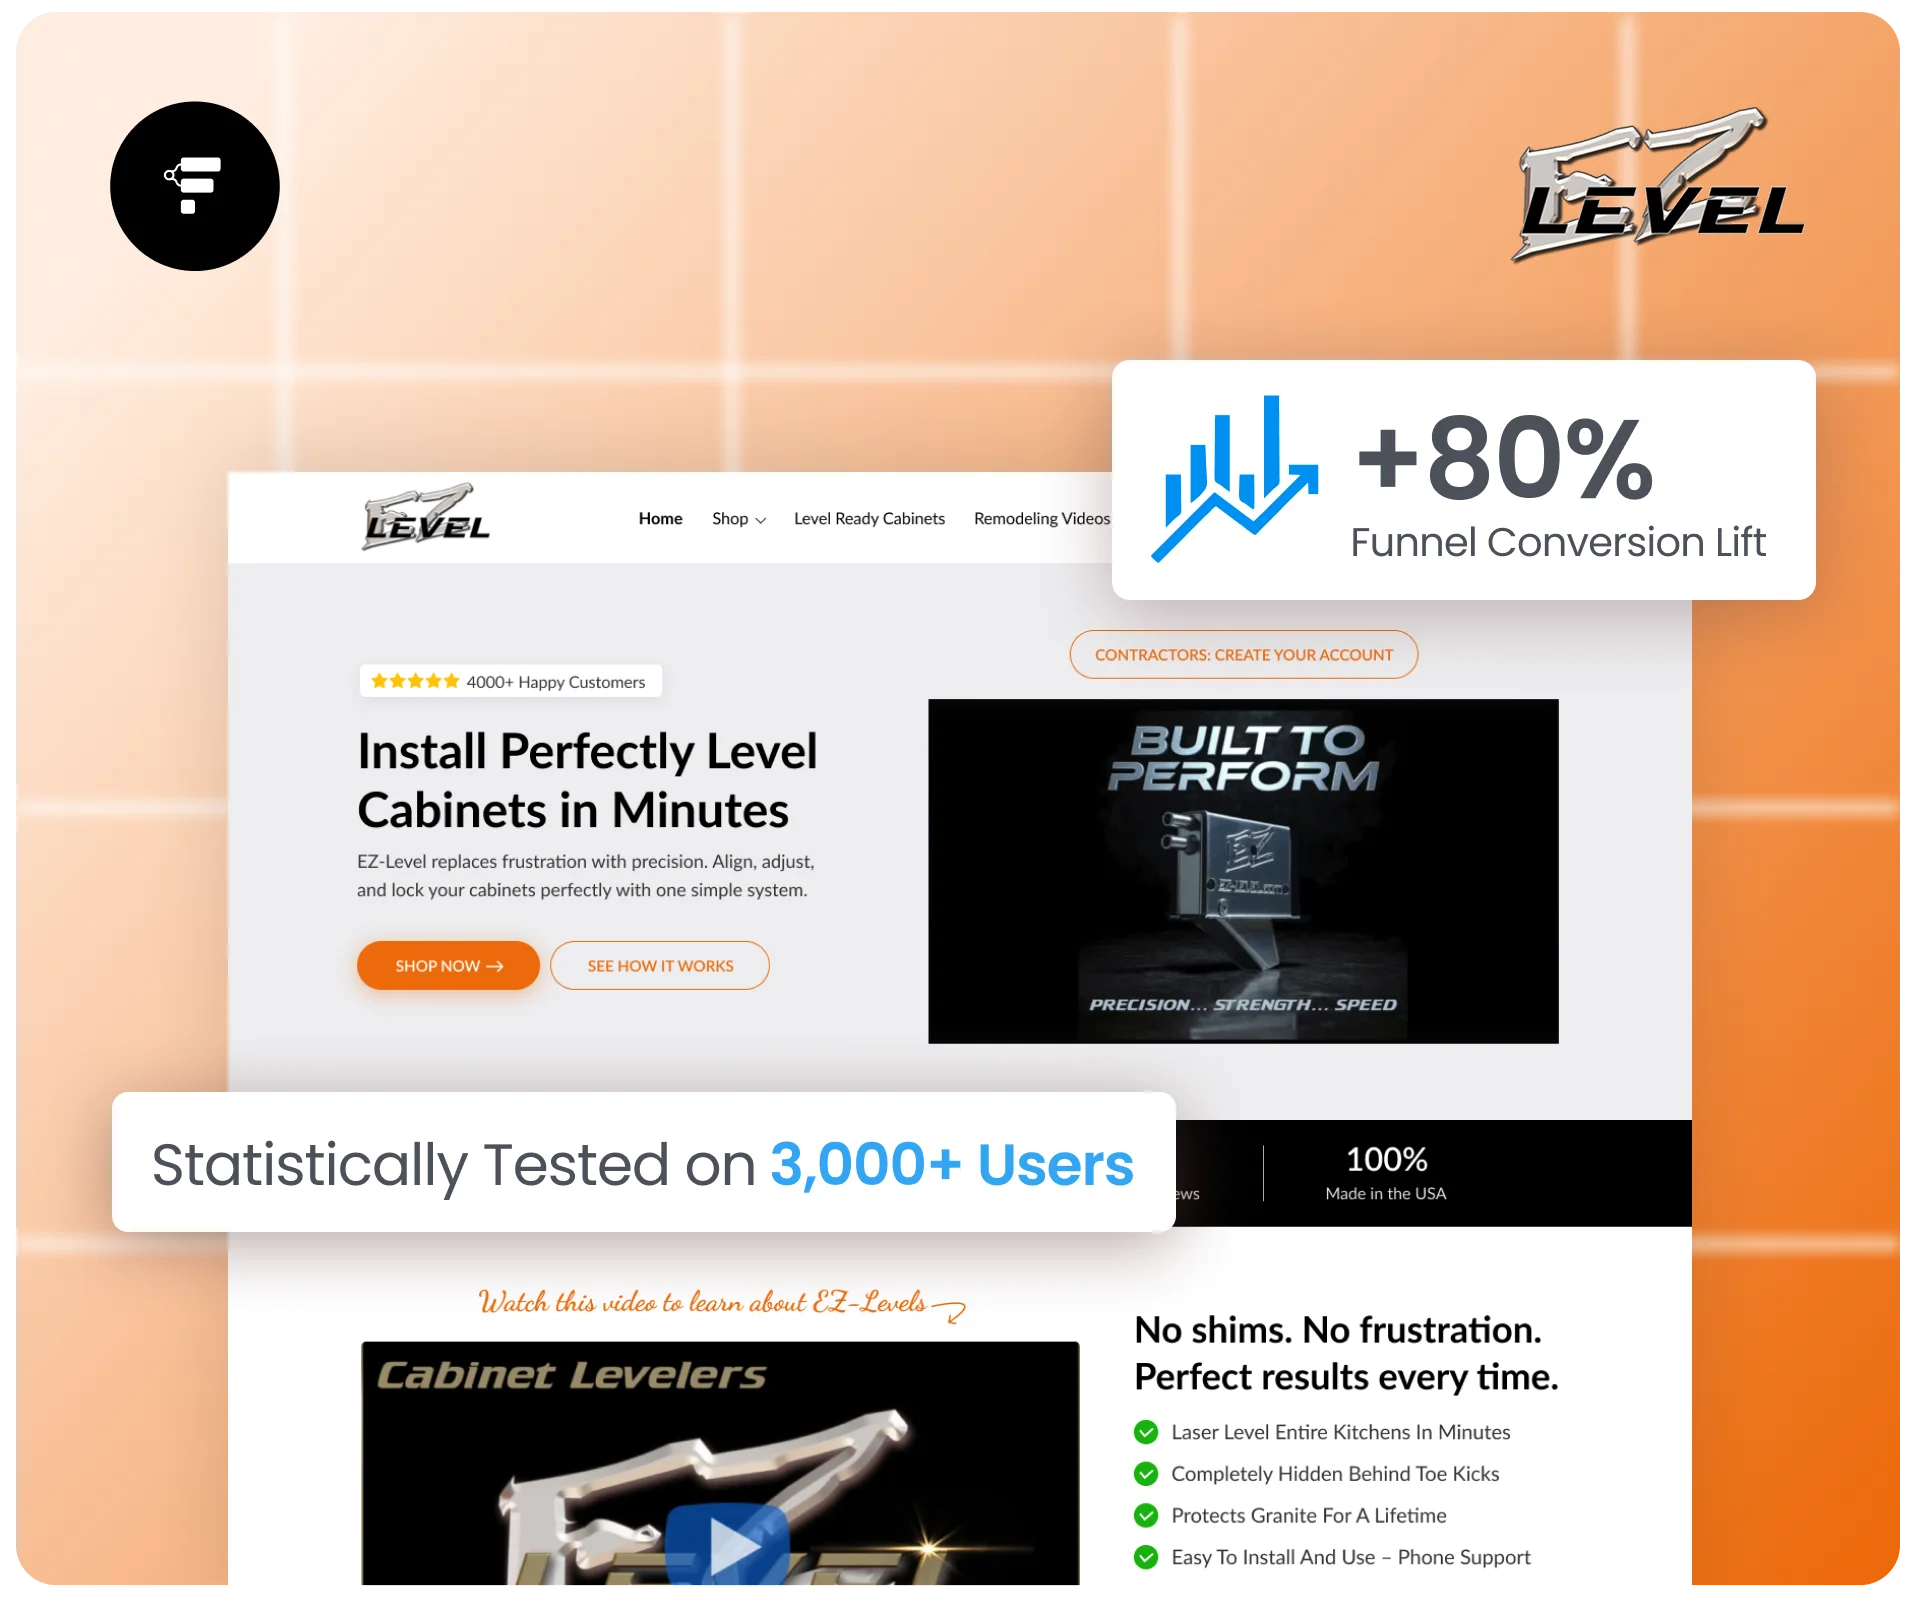
+80%
Purchase conversions

How EZ-Level increased purchase conversions by 80% through iterative CRO optimization.

READ FULL CASE STUDY
AOV increase case study preview
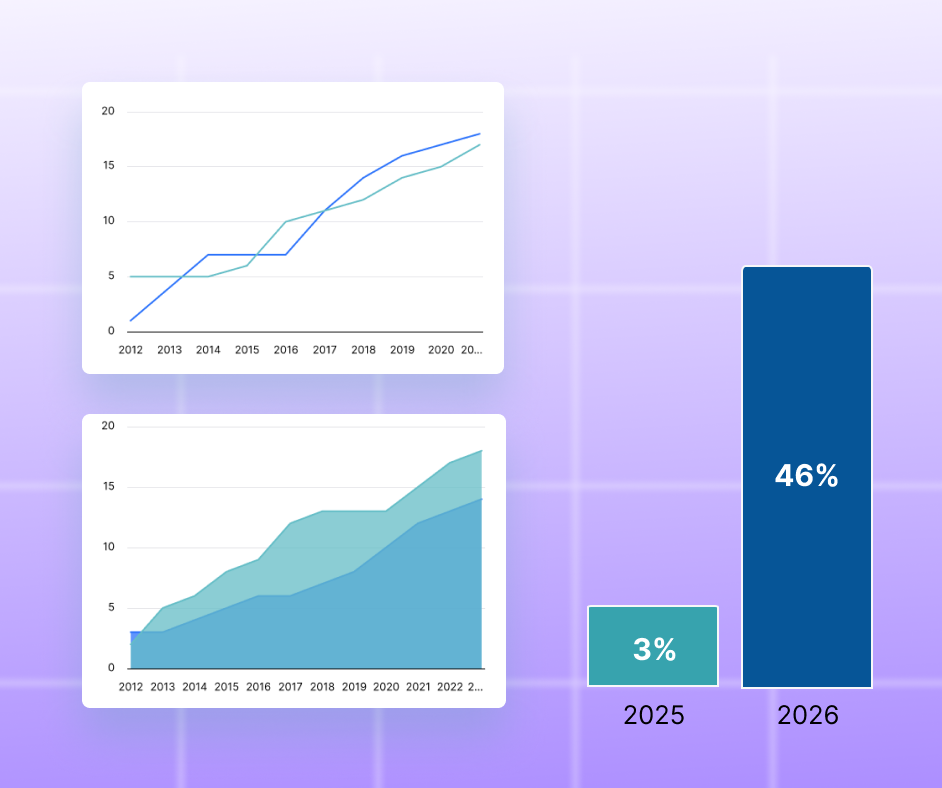
+46%
AOV increase

Four Sigmatic uses customer journey analytics and increased their AOV by 46%.

READ FULL CASE STUDY
Checkout conversion case study preview
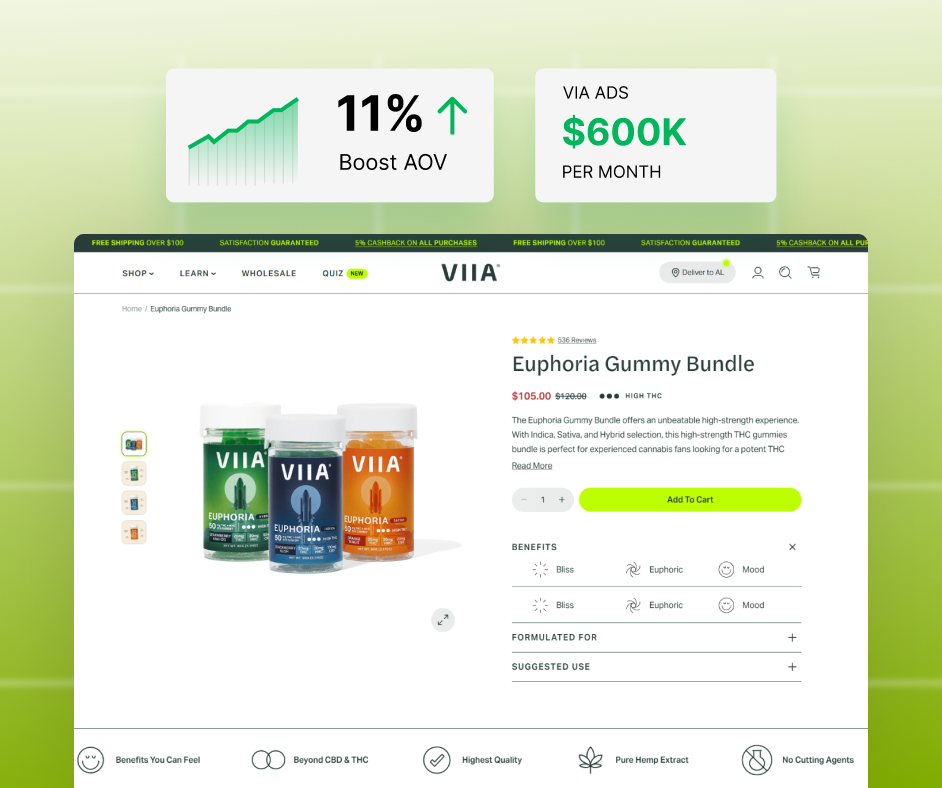
2×
Checkout conversion

VIIA scaled to $500K+/mo in ads — we streamlined tracking and boosted AOV 27% while doubling checkout conversions.

READ FULL CASE STUDY
In monthly additional revenue case study preview
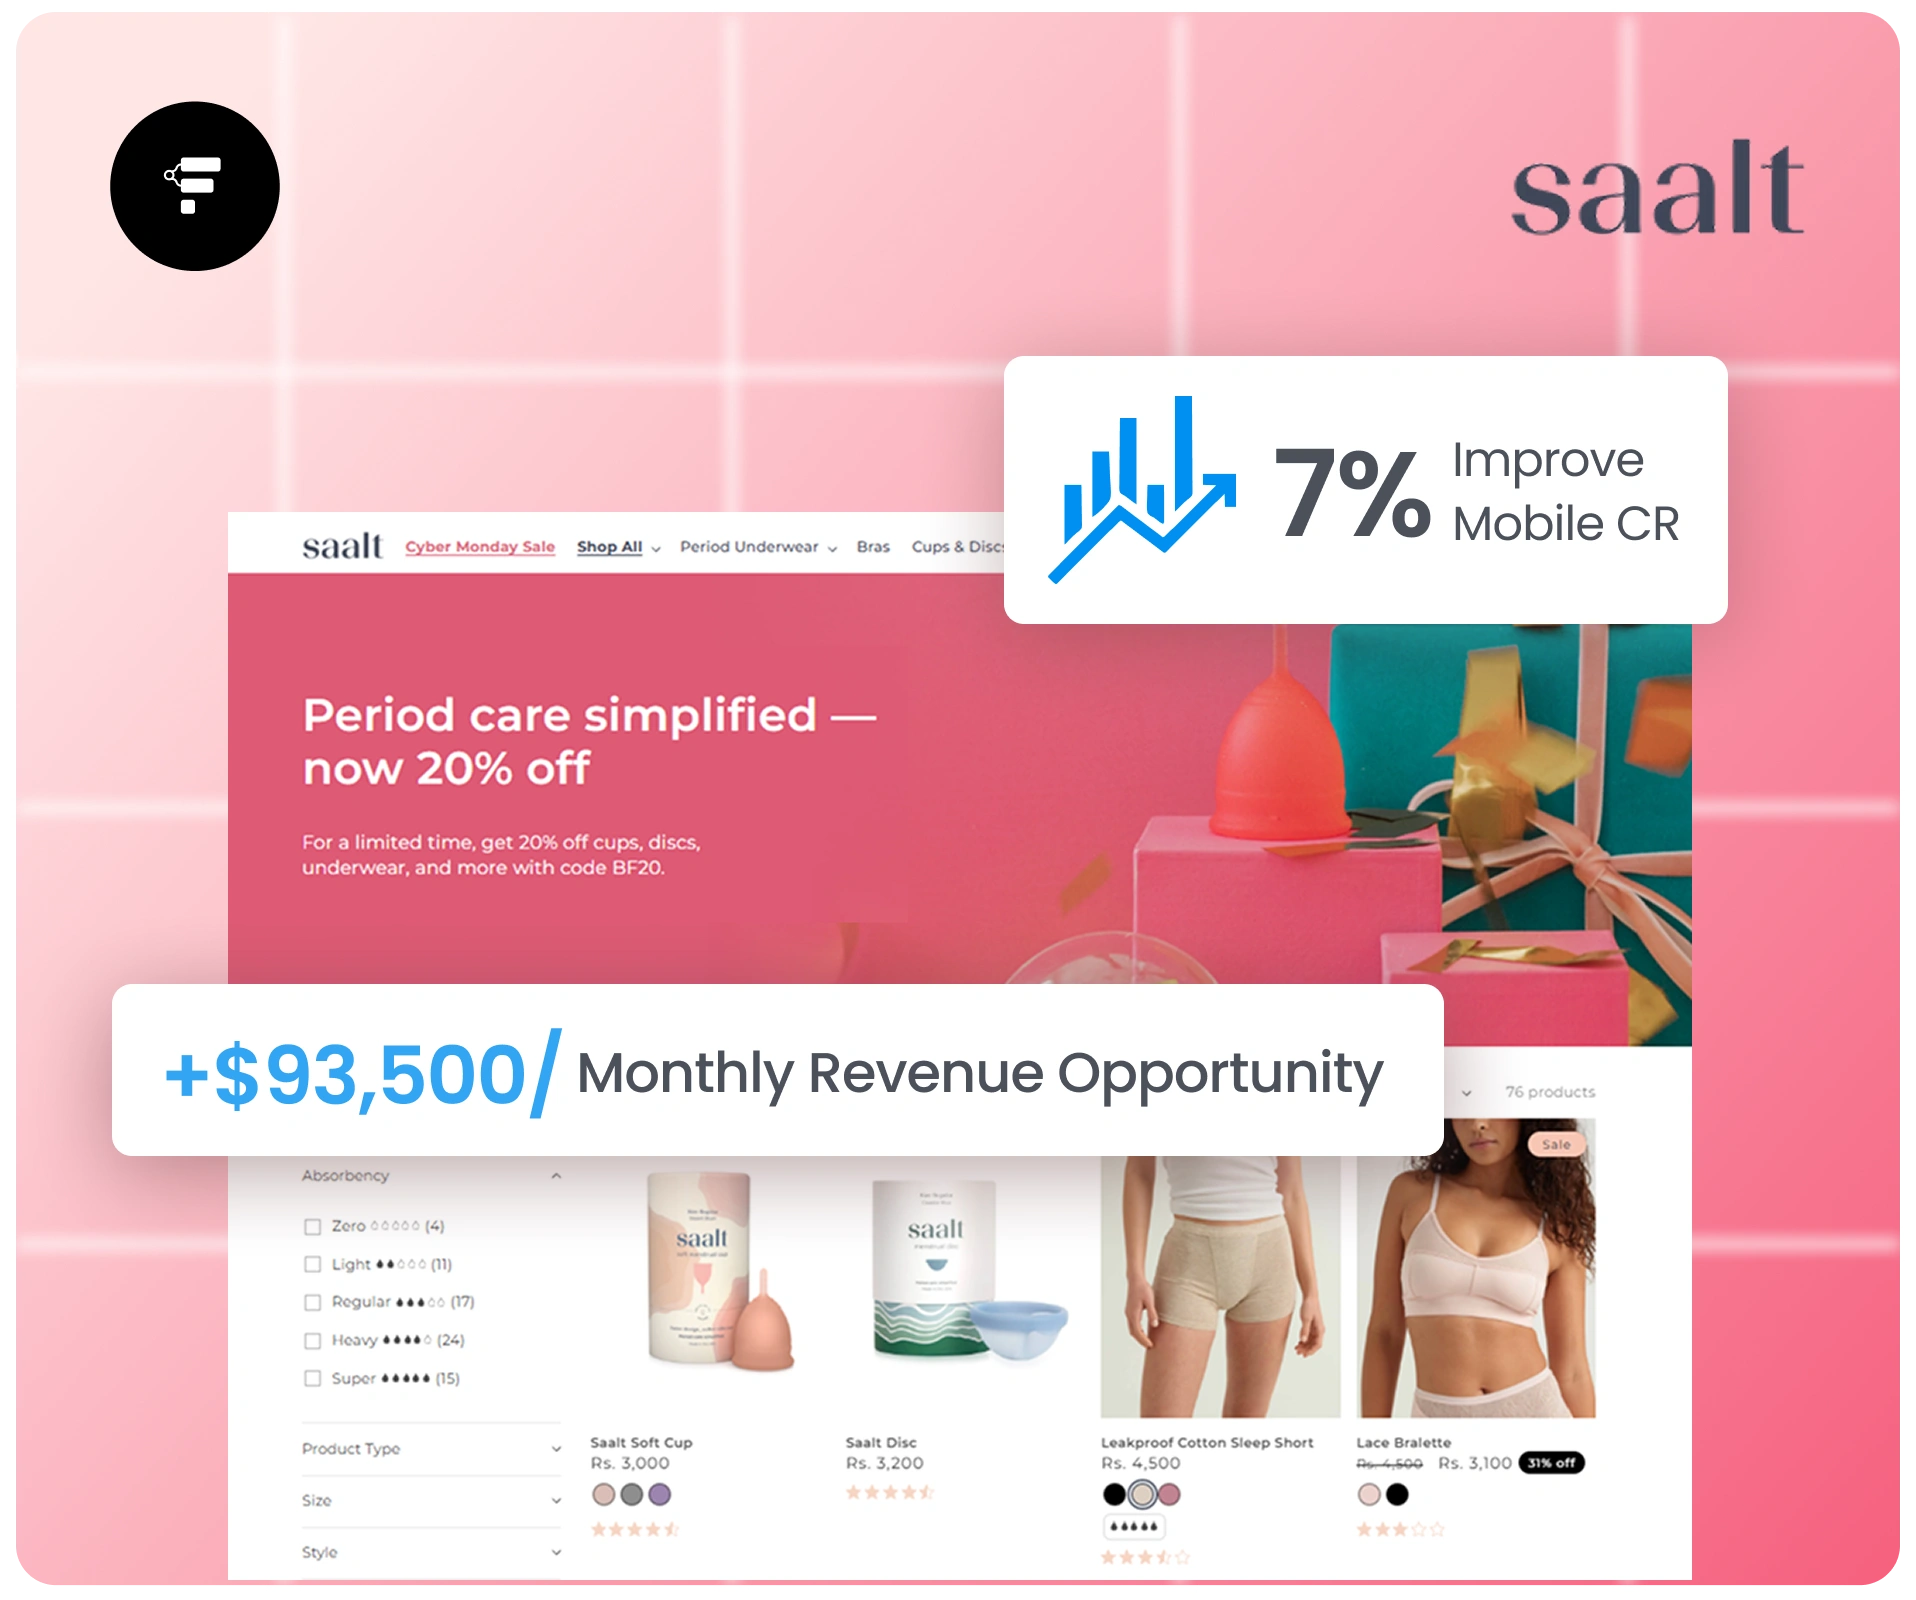
+$93K
In monthly additional revenue

Found major inefficiencies in media spend where SAALT buyers converted and dropped off.

READ FULL CASE STUDY
Conversions case study preview
+20%
Conversions

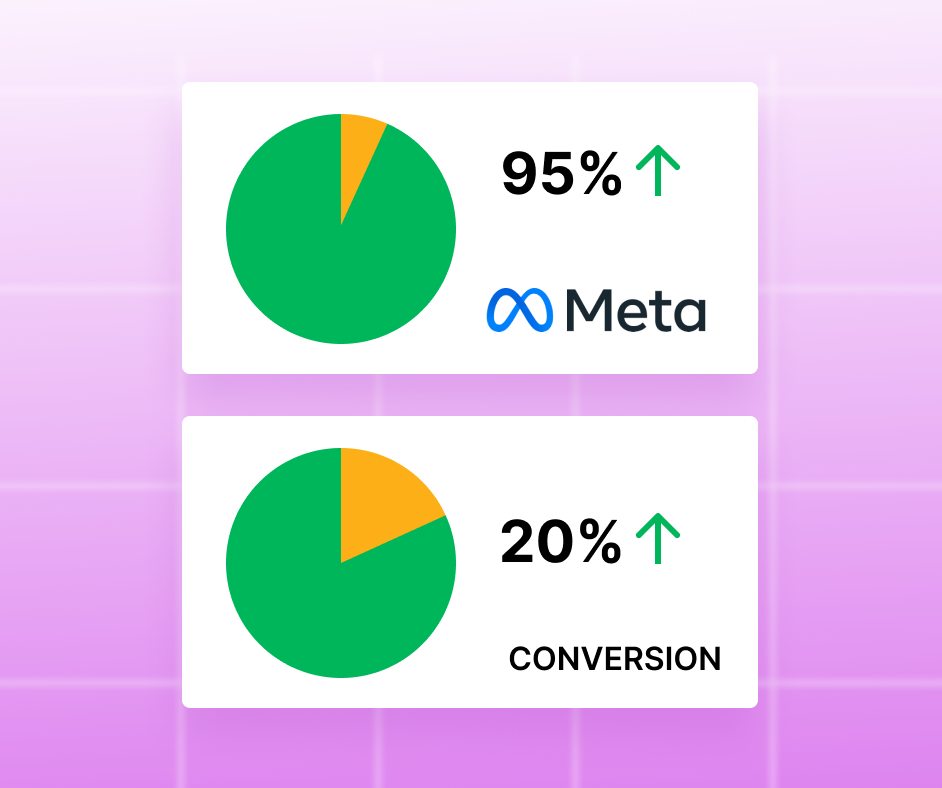
Lindywell cut wasted ad spend, found 95% of sales off Facebook, and boosted conversions by 20%.

READ FULL CASE STUDY
Reduction in Cost per Sale case study preview
-75%
Reduction in Cost per Sale

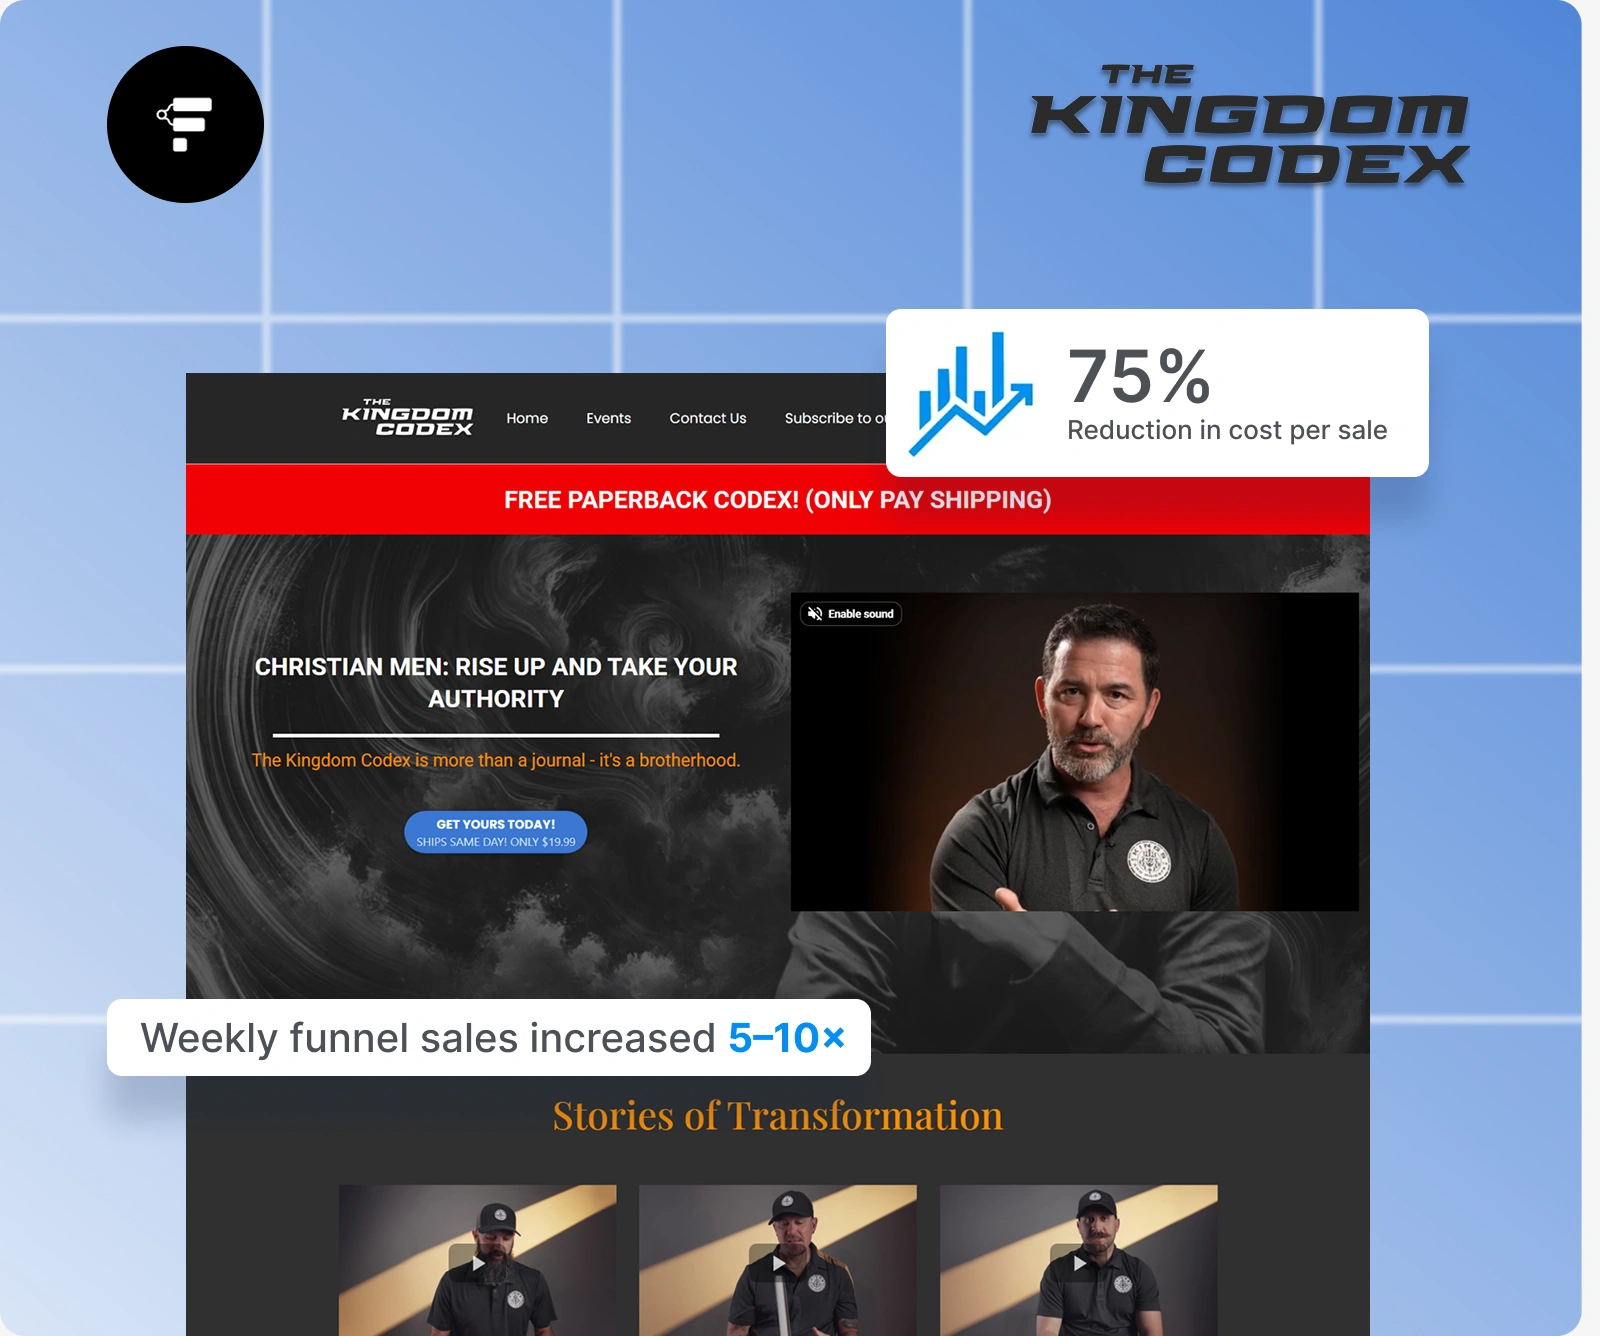
Kingdom Codex: a data-driven breakdown of scaling paid traffic through funnel optimization.

READ FULL CASE STUDY

In their own words

Real quotes from real growth teams — pulled straight from calls and published case studies.

"Funnelytics helped quiet down that noise and gave us a reliable source of data we can rely on to make decisions."

Eyal Marmareli
Eyal Marmareli
Trophysmack

"The visual aspect has been the biggest game-changer for our entire team. We show the map on a team call and instantly everyone can follow."

Theresa Loe
Theresa Loe
Lindywell

"They've uncovered things we'd never have found on our own."

Jessi Means
Jessi Means
ChappyWrap

"Whether you're a one-man team or a 50-man team, Funnelytics will always come in handy. You can never argue with data."

Bren Higuera
Bren Higuera
Indacloud

"Even at $500K per month we were flying a bit blind on what products and customer paths were driving the most revenue. Funnelytics gave us that clarity and we increased our AOV by 27%."

Bren Higuera
Bren Higuera
VIIA

"Our AOV increased by 46% from simple changes recommended by Funnelytics. It replaced all the overcomplicated tools we were using before."

Rick Cadotte
Rick Cadotte
VP of Growth, Four Sigmatic

"We saw a 17% boost in lead-to-customer conversions and dropped acquisition costs by 10%. The insights made the invisible visible."

Bruno Leite
Bruno Leite
Mkt4Edu

"We cancelled every other analytics tool and stayed with Funnelytics — because it actually drives action."

Judith Davila Chaud
Judith Davila Chaud
IATA

"We are already feeling an immediate impact after only a month. I wish we had found them years ago."

Kylie Burnside Anfin
Darren Hardy

"Their insights service gave us a clear, visual representation of our data — we could see our leads' journey, find the bottlenecks, and adjust with confidence."

Carrie Circosta
Carrie Circosta
The Contracting Blueprint

"Helped us identify issues in our funnels and how to increase our conversions."

Nate Stavseth
Nate Stavseth
Raging Bull

"Funnelytics helps us visualize our campaigns and traffic to understand flows. There's nothing like it."

Chris Schelzi
Chris Schelzi
AppSumo

"It's easily made my agency hundreds of thousands of dollars over the years."

Baillie Thornhill
Baillie Thornhill
Fractional CMO

"It offers a much more robust level of insight into consumer behavior than other analytics tools."

Dusty Rich
Dusty Rich
CashorTrade

Convert more of the traffic you already have.

Book a call and see how our team would grow your store from the same spend.

Book a call or install our free Shopify app to get started